Livongo’s Data
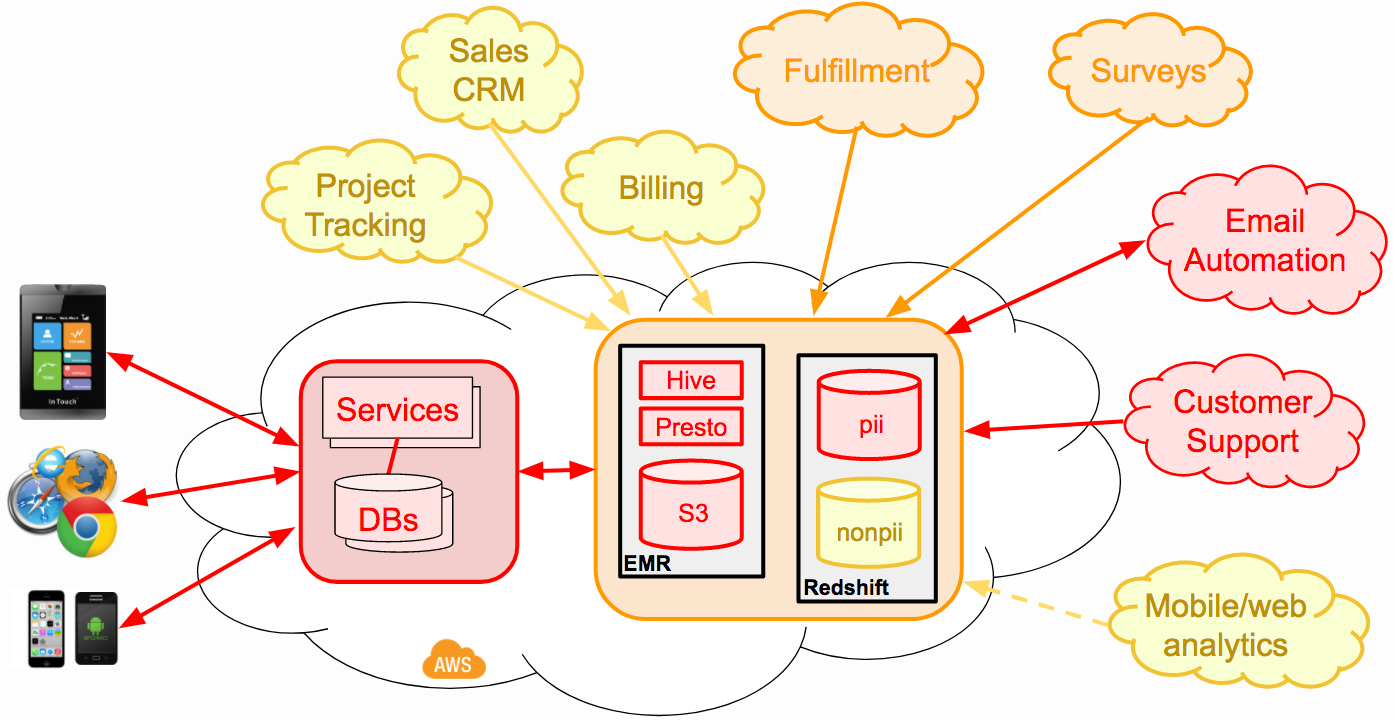
Like most technology companies, Livongo Health uses a rich set of internal systems and best-of-breed cloud services to deliver our own product to the people who rely on us. As Chris describes in his Tech Overview post, we store key information in our internal runtime databases, but also leverage a number of (HIPAA-compliant) external cloud services for key parts of our offering:
- Email/SMS automation (SFDC Marketing Cloud)
- Service ticketing/routing (SFDC Service Cloud)
- Surveys (Survey Monkey)
- Event-level analytics (Mixpanel)
- Client project tracking (Atlassian JIRA)
Each of these “source of truth” systems provides their own tools and interfaces for observing the performance and utilization of those services, but they don’t provide a way to cross-reference activities and trends between each walled garden. For example, Marketing Cloud provides dashboards to see the open/click/bounce rates of email campaigns, but they can’t correlate those emails against downstream activities that happen in other systems.
The standard solution to this problem is to build a unified data warehouse that pulls in information from internal and external data sources so that you can perform all of your correlations and aggregations in a single place. Since we’re using AWS to run our (HIPAA-compliant) service, we built our analytical data warehouse in-house using a combination of EMR/Hadoop and Redshift:

ETL (or ELT)
A data warehouse like this needs to be fully updated at least once per day to provide usable insights and fuel for the data science furnaces. The process of reliably ingesting and normalizing all of the data from heterogeneous sources is traditionally called “Extract, Transform and Load,” or ETL. (In reality, we’re doing something more like “ELT”, but the older TLA has better SEO, so I’m sticking with it…)
There are some very robust commercial and open-source frameworks that make common ETL workflows very simple with drag-and-drop interfaces. In particular, if you’re mostly moving data from a runtime SQL database into an analytics database like Redshift, you can configure powerful mappings in either a UI or configuration files using ETL tools like Talend, JasperSoft, or Pentaho.
The heterogeneous nature of our internal and external data made these omnibus frameworks more of a hindrance than a help. We’re dealing with too many funky APIs and custom data formats to get the real benefit of a UI-driven configuration system. But we do have a complex workflow with robust requirements:
- Strict dependencies (don’t update data/table Z unless we’ve updated X and Y first)
- Parameterized execution, to support re-use on both test and production environments
- Scheduled execution ala cron
- Easy to start manually and track progress of execution flow
- Authoring via SCM with code review, branching, etc.
- Halt on failure of any processing step or data “unit test”
- Resume on a failed step after fixing it, without re-running the whole workflow
In my last gig, we bought one of the commercial ETL solutions, but ended up building high-volume data workflow using only a top-level bash script relying on an excessively-clever use of a case statement with the the “;&” pass-through operator. This satisfied many of the requirements, but the interactivity and tracking was awful (ssh).
Jenkins, at your service
At Livongo, we decided to implement the data workflow using a sequence of steps coordinated through a Jenkins job using the standard Pipeline plugin. We were already heavy users of Jenkins for building our software and performing other CI/CD steps, so it was easy to leverage existing skills and tools to support this additional use.
A “Declarative” Pipeline workflow like ours is typically written as a single text file in the SCM repo that specifies a sequence of named “stages”, each with one or more “steps”:
pipeline {
    agent any
    stages {
        stage('Build') {
            steps {
                sh './doSomething.sh'
            }
        }
        stage('Test') {
            steps {
                build job: "Some Other Project"
            }
        }
    }
}
There are an absurdly large variety of steps available various plugins, but we mostly use the basic steps for things like execution of shell commands.
We decomposed our ETL pipeline into an ordered sequence of stages, where the primary requirement was that dependencies must execute in a stage before their downstream children. This strict linear ordering isn’t as powerful as some sort of freeform constraint satisfaction system, but it should meet our requirements for at least a few years.
The steps in each stage are configured to use some tool to move data from one place to another. To move data from MySQL tables to Redshift, we invoke Apache sqoop. To move data from cloud services, we use simple tools that fetch from their APIs. Internal transformations and aggregations within the data warehouse just trigger SQL scripts in the same SCM repository as the Jenkinsfile script.
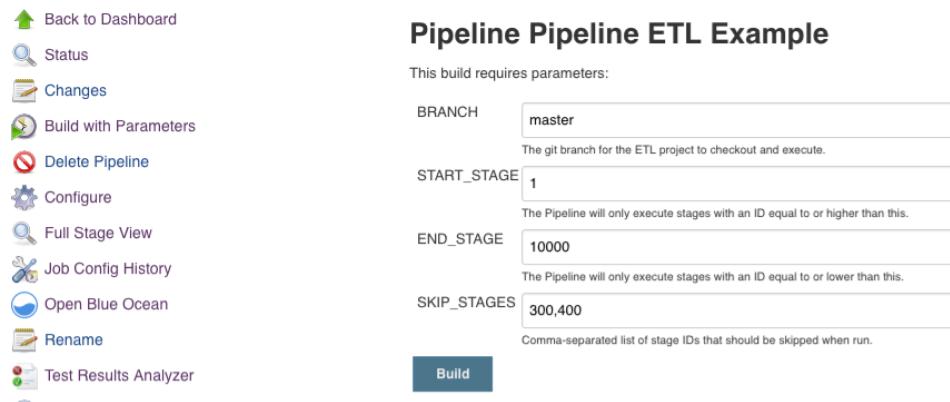
A Jenkins Pipeline can be configured with “parameters” that are passed to the steps as environment variables. We specify default parameters for things like git branch, database hostnames, etc. The values for these parameters are changed for each environment, and they can also be changed manually when the job is executed interactively.
Stage Directions
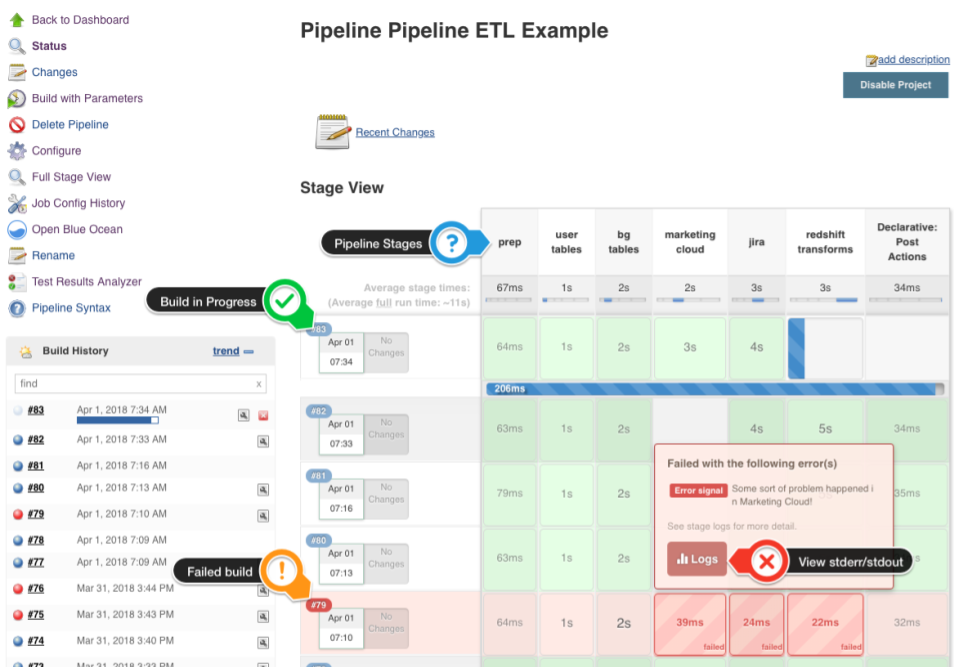
The straightforward pipeline meets virtually all of our requirements (above). We can start scheduled or manual runs and track their progress through the Jenkins web UI as they proceed through stages. Any failed step stops the job, preventing upstream errors from snowballing.

The one requirement that the Pipeline plugin doesn’t satisfy with standard features is the ability to restart the ETL at a particular stage after fixing the root cause of a failure. If the ETL fails at the second-to-last stage of a 60 minute pipeline, it’s not practical to restart at the beginning.
Standard Pipelines don’t give any ability to specify a “starting stage” for a specific run. Generalizing this further, they also don’t give any standard control for controlling the “ending stage” or the ability to skip specific stages during an execution. There are times you just want to run a single stage to test something or clean up after a data correction.
We’ve implemented this flow control by adding some Groovy code that parses special named job parameters (START_STAGE, END_STAGE, SKIP_STAGES) that can be tweaked with each execution. By specifying a numeric ascending “stage ID” to each stage, we can control stage execution using one line of boilerplate per stage:
pipeline {
  agent any
  stages {
    stage('prep') {
      steps {
         script {
           director = new Director(this)
         }
      }
    }

    stage('user tables') {
      when { expression { return director.checkStage(100) } }
      steps {
        echo "Fetching user tables..."
        // ...
      }
    }

    stage('bg tables') {
      when { expression { return director.checkStage(200) } }
      steps {
         echo "Fetching BG tables ..."
         // ...
      }
    }
    // ...
  }
}

class Director {
  int startStage = 0
  int endStage = Integer.MAX_VALUE
  def skipStages = []
  int lastStageId = 0
  String lastStageName = ""
  def workflow = null

  Director(workflow) {
    startStage = workflow.env.START_STAGE.toInteger()
    endStage = workflow.env.END_STAGE.toInteger()
    skipStages = workflow.env.SKIP_STAGES.tokenize(',').collect { it.toInteger() }
    this.workflow = workflow
  }

  boolean checkStage(stageId) {
    if (startStage <= stageId && endStage >= stageId && !skipStages.contains(stageId)) {
      lastStageId = stageId
      lastStageName = workflow.env.STAGE_NAME
      workflow.println "Executing stage " + stageId + " (" + workflow.env.STAGE_NAME + ")"
      return true
    } else {
      workflow.println "Skipping stage " + stageId + " (" + workflow.env.STAGE_NAME + ")"
      return false
    }
  }
}
The ‘Director’ helper class also captures the name and ID of each stage as they run, so we can report details about any failures via email.
Now, when someone wants to execute the pipeline (or schedule it via Jenkins’ Parameterized Scheduler), they can control which stages they want to execute for that run, and which they would like to omit:

All the world’s a stage
We’ve been fairly happy with the control and usability that Jenkins has given us for our top-level control framework. Our master pipeline has a couple dozen stages, using many smaller tools for fetching and processing data. We’ve decomposed some large domains into their own Jenkins projects, which can be invoked from within the master pipeline either synchronously (blocking) or asynchronously.
This permits us to, for example, integrate offline machine learning runs into the pipeline after all of their required data has been fetched and transformed in the data warehouse. Various reports and dashboards are triggered in later stages once everything else goes smoothly.